
Environmental Data
The last decade saw the warmest temperatures ever recorded by humans. It was also a decade of incredible advances in energy efficiency and progress towards cheaper and cleaner power. Developments in transportation, electricity generation, and renewable energy sources are making progress towards a cleaner, more sustainable future.
In support of its mission to help support sustainable advances, FreightWaves offers more than 1,000 environmental data indices inside of SONAR that enable participants to understand and model how emissions are being impacted through various market changes and technologies.
FreightWaves offers hundreds of carbon dioxide emission indices in SONAR. The full list of indices available to SONAR users can be found in the Knowledge Center here. The carbon dioxide emissions are U.S.-centric and are all separated by fuel type. These indices are especially helpful in understanding who receives carbon credits in California.
ENVIRONMENTAL IMPACTS TRACKED INCLUDE:
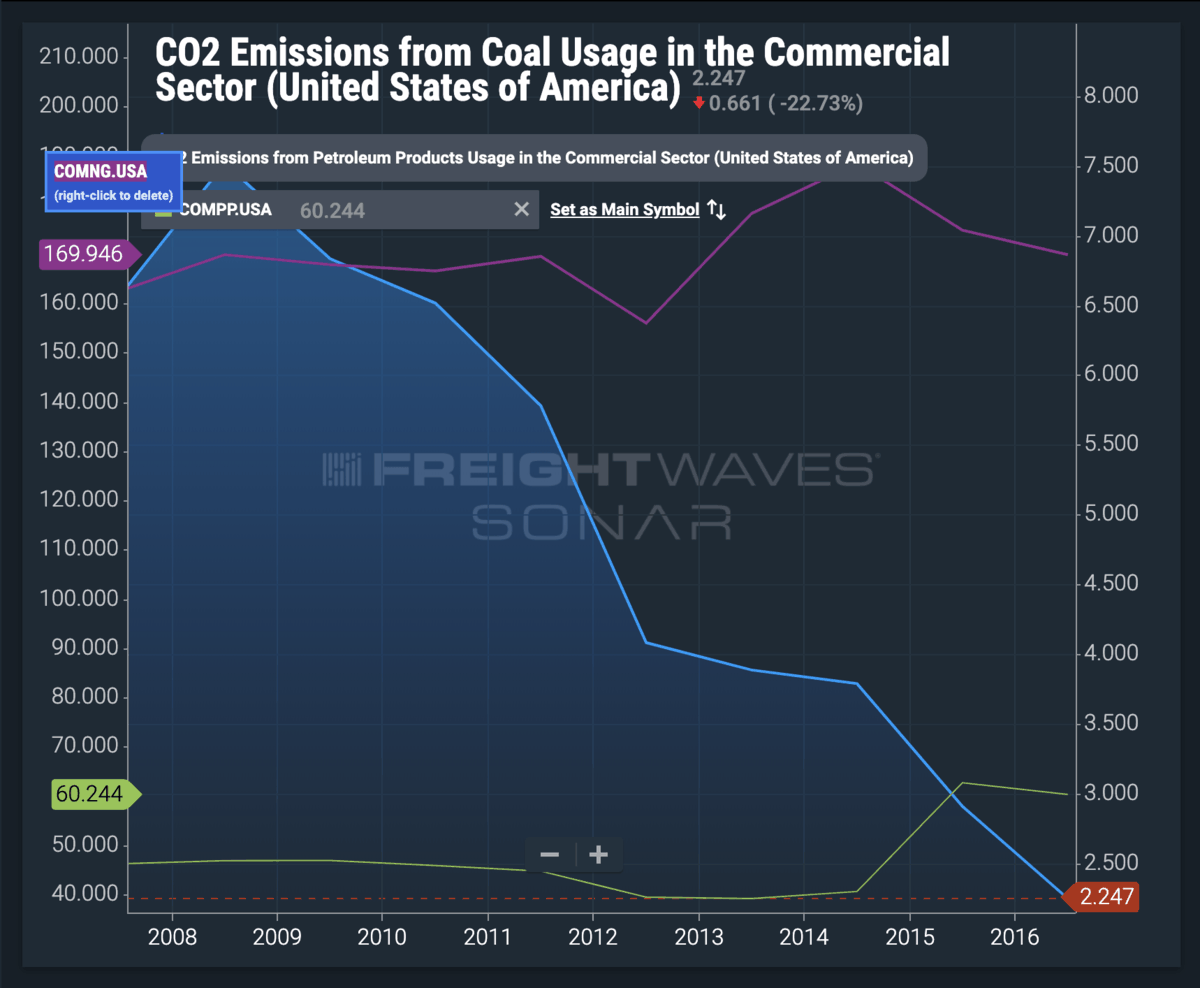
- CO2 emissions (by sector)
- Biodiesel production
- Biodiesel consumption (by sector)
Carbon Data
The U.S. Energy Information Administration (EIA) collects information on greenhouse gas emissions to monitor their potential impact on the environment. It monitors carbon dioxide emissions (CO2) – the primary greenhouse gas emitted by various activities throughout the world – released by power source and sector.
In SONAR, the focus is on fossil fuel consumption of non-renewable resources because these are the main sources of CO2 emissions, representing 77.6% of the U.S. primary energy production in 2017. Power sources include the fossil fuels: natural gas, coal and petroleum products. Renewable energy, including solar, wind and geothermal energy, accounted for 12.6% of the primary energy production in 2017, with nuclear comprising 9.6%. Sectors include: commercial, electric power, industrial, residential and transportation.
Electric power is the primary source of energy consumption representing 38.1% of the total share in 2017. Transportation was second at 28.8%, industrial 22.4%, residential 6.2%, and commercial 4.5%.
CO2 emissions in SONAR are expressed in millions of metric tons per state. The transportation of these fossil fuels has a major impact on transportation. For instance, coal is primarily moved by rail. As coal production declines, railcar volumes fall with it and railroads will need to replace that volume with other commodities or freight.
The petroleum sector drives a large part of the freight economy. As petroleum production increases so does demand for capacity. Petroleum and its derivatives, such as plastics, are hauled across the country on trucks. When petroleum production declines, as it did in 2016, so does demand for trucking capacity.
Regardless of individual stances on environmental issues, regulations and behavior patterns are constantly changing. Having the ability to monitor the primary factor in these areas, CO2 emissions, gives transparency to SONAR users.
Biodiesel Data
Biodiesel data, in combination with the existing energy data, can give insights to energy demand and demand for the different types of fuels. In California, more carbon credits are given to fuel producers that produce fewer emissions than others. Currently biodiesel emissions (BDTCE.USA) are decreasing as refining processes are becoming more efficient, meaning they receive more carbon credits than a fossil diesel producer at the same scale. The emissions produced are a function of technology and consumption.
Those that must comply with California’s regulations regarding carbon emissions – and those who may have to comply with future regulations in other areas – should understand the basis of the policies made. Additionally, emerging and expanding fleets have more options with compliance in California as technology changes, opting for other, alternatively fueled trucks. Making an informed, data-driven decision will result in a more cost-efficient long-term outcome.
Biodiesel is growing in the fuels market as a “greener” alternative to diesel, with minor modifications needed to use it. Biodiesel not only emits fewer carbon emissions, it also creates less particulate matter and fewer sulfur oxide and nitrogen oxide emissions. Furthermore, it can be used in place of diesel, and producing it is cleaner.
As new regulations take place, biodiesel will likely become a viable option for diesel consumers. In 2020, cheaper alternatives like biodiesel will see an increase in demand, which will drive production. The fuel markets are changing as new regulations limit emissions or the types of fuel being used. As the demand for ultra low sulfur diesel goes up, the limited supply drives up prices and drives demand for alternatives.
Using the biodiesel data, SONAR users can begin to understand the demands for an alternative to diesel. This begins at the basic production and consumption level, then moves to the stock, or what is being stored and what is being taken out, and the imports and exports. Understanding this movement allows the user to understand the market and make educated decisions on what their company’s needs are.
Stocks and Changes in Stock
These SONAR indices show the amount of biodiesel being stored once it has been produced. Starting in March 2019, more biodiesel was consumed than produced. The stock change shows more being pulled from storage than being put into storage. Also, the biodiesel stocks show the amount of barrels stored decreasing. Biodiesel being stored underground in tanks has to be a certain blend.
Imports and Exports
Imports and exports of biodiesel are a way to measure where demand is going, within the United States or outside of the country. In May, the U.S. became an exporter of biodiesel after years of negative net exports, or primarily importing more biodiesel. As more production occurs, the U.S. will continue to expand exports.